 |
| Exhibit 1 |
Photo from MSNBC
In mid February 2021,Texas (and several other states) are still reeling after a terrible and unusual (but far from unprecedented) winter storm.
This storm came while I was organizing materials for The Future of Real Estate. FoRE, as we abbreviate it, is a project begun in 2018 with my colleagues Morris Davis and Julia Coronado; I have worked on it off and on since then. As the storm hit I was preparing some material on infrastructure, focusing for the moment on energy.
Given the connection between my recent reading and writing on FoRE and recent events in Texas and elsewhere, I decided to take a time out and do this post.
FoRE and my own interests in general tend to focus long run. But sometimes it’s important to look at the short run, obviously including emergencies and disasters. Some of my most “learnable moments” spent with my students at Wisconsin came when students chose to do projects on disasters such as the Fukushima nuclear reactor, the earthquake in Haiti, and Hurricane Katrina. Disasters and emergencies (including the current pandemic) are obviously important in their own right. But they can also clarify weaknesses and issues that affect cities and real estate markets and infrastructure in the long run as well.
Some Basics
 |
| Exhibit 2 |
Photo from Teen Vogue
As I write this on February 21, much of Texas has electricity again, but some 14 million Texans are still waiting for the return of safe water supply.
Graphic from the
New York TimesThe February 2021 storm certainly was not limited to Texas; severe cold and often snow struck much of the central U.S., from Minnesota and the Dakotas down through Texas and Oklahoma and Louisiana, as Exhibit 3 shows. As the storm hit in mid-February about 150 million people or a bit less than half the U.S. population was under storm warning. The first day of the storm Austin recorded a temperature of 8° F and about 7 inches of snow. That’s weather that Boston or Milwaukee would shrug off, but it was the largest recorded snowfall in Austin in 55 years.
The mid-February shortages are unusual and extreme but not unprecedented and like the COVID pandemic, no black swan; perfectly anticipatable except for the timing. Texas has been through dress rehearsals for this, e.g. in the “Groundhog Day” storm of 2011, but failed to heed the warnings. And if you think that single digit temperatures like the ones recorded in Austin wreak havoc remember, that Texas has had much colder episodes in the past including the 1994 record cold snap in West Texas that reached 20°F below zero.
 |
| Exhibit 4 |
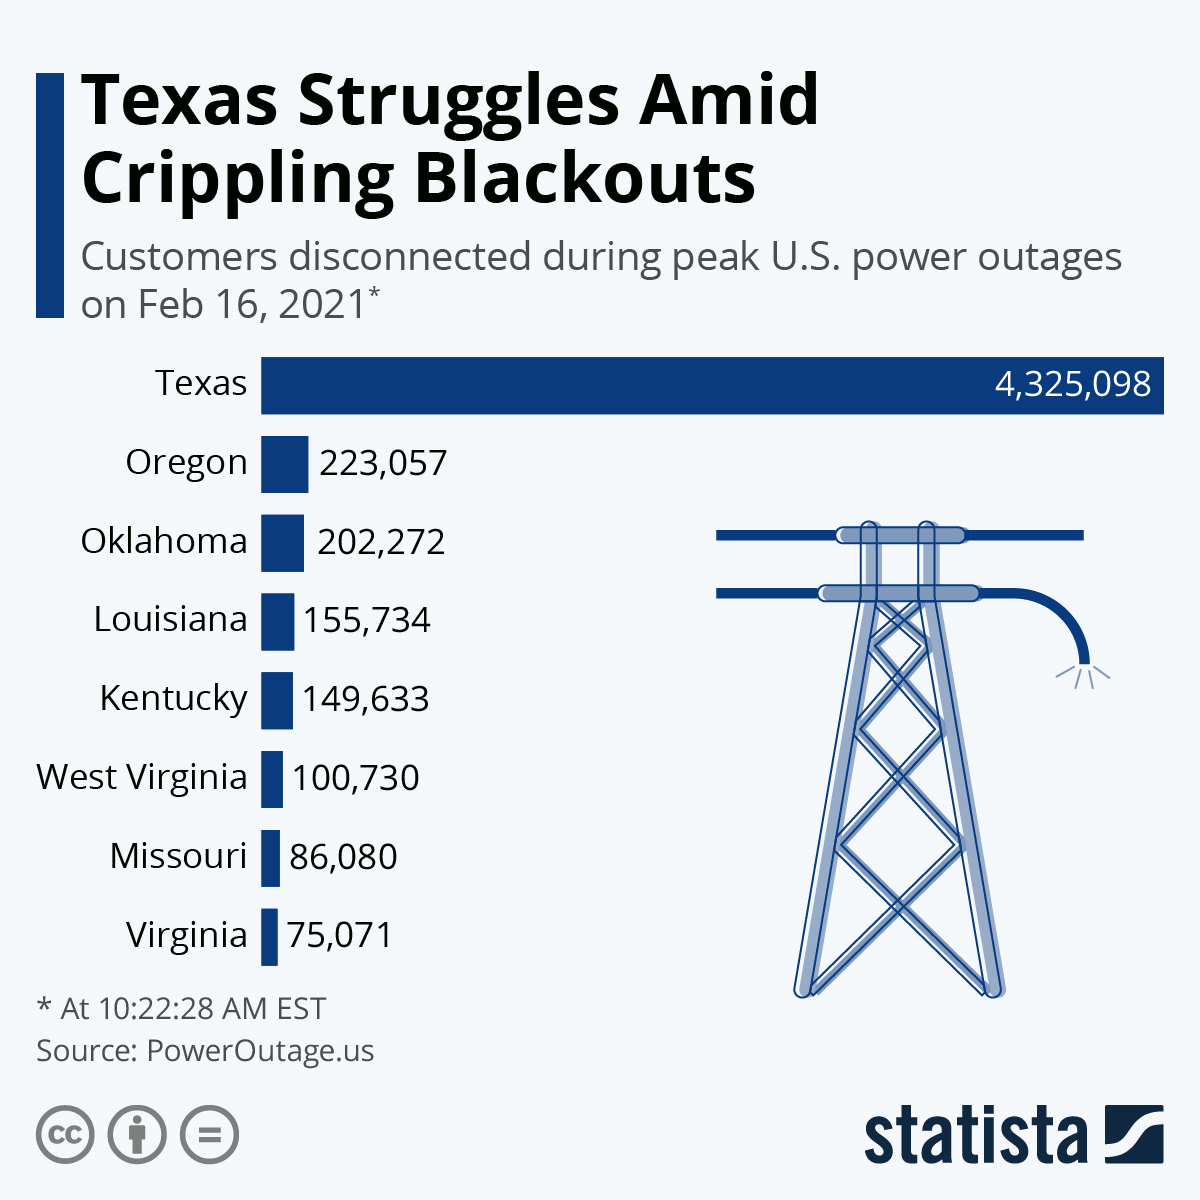
Graphic by Statista
Exhibit 4 shows that the number of Texas customers disconnected at the peak of the blackout, over 4 million, dwarfed the number reported from other states. The graphic above, while correct, is a bit misleading because Texas' population also dwarfs the other states listed.
The 4.3 million could be compared to Texas' population of 29 million, while neighboring Oklahoma's 200K compares to a population of 4 million.
Assuming all the disconnects are retail customers, and a household size of 2, at the peak about 30 percent of Texas' population was off the grid, while Oklahoma's ballpark estimate comes in at about 10 percent. There's a huge difference, though: many, at first most, of Texas outages continued for days, while most of Oklahoma's were back online in a reasonable time. Why? To some extent because Oklahoma had winterized more effectively, but even more so because Oklahoma was a medium-sized state well-connected to the national grid, unlike Texas. More on this below.
For the record, our ballpark estimates of the percentage of a state's population initially disconnected are about 10 percent for Oregon; 6 percent for Louisiana; 6 percent for Kentucky; 12 percent for West Virginia; 4 percent for Missouri and 2 percent for Virginia.
(Thanks to my colleague Meagan McCollum of Tulsa University, who pointed out my howling error in the first posting: I mixed up Oklahoma City and state populations. Keep those comments and corrections coming!)
The Human Cost
 |
| Exhibit 5 |
Photo from the New York Times
"Workers helped Dori Ann Upchurch into a warming station at University Avenue Church of Christ in Austin. She evacuated her home after she lost her water supply."
This photo is one of a number of remarkable photos available at a
New York Times photo essay that I highly recommend. Let me comment on just a few of them.
 |
| Exhibit 6 |
Photo from the New York Times
I’ve had the opportunity to work in a number of low-income countries and learn from many colleagues and friends in such environments. One of the important but underappreciated problems in many informal settlements in Africa, South Asia, and elsewhere stems from the use of indoor fuels for cooking and heating. Globally 3 billion people use open fires or simple stoves that give off noxious fumes; close to four million people die prematurely every year from illnesses attributable to such pollution.
This photo of a Texan family from the New York Times collection brought to mind these tragic issues although I took some comfort from the reporting that this particular family was only cooking indoors very temporarily.
A number of the fatalities attributed to the storm are from carbon monoxide poisoning from dangerous indoor heating.
 |
| Exhibit 7 |
Photo from the New York Times
Anyone who works in informal settlements and low-income countries (“slums”) in countries like Kenya India Brazil familiar with pictures of residents filling bottles and buckets from standpipes and water trucks. This photo from the New York Times photo essay brought back those memories.
 |
| Exhibit 8 |
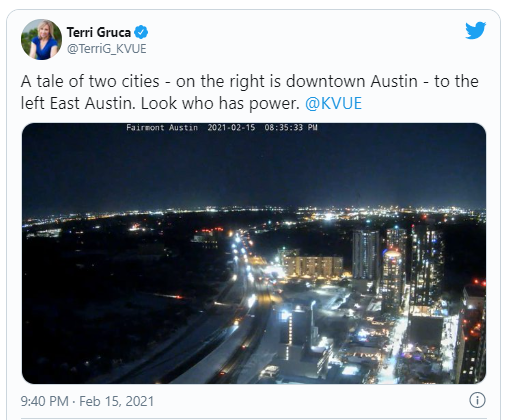
Source:
Twitter
As the Axios and the New York Times reported, Texas power shortages often hit minority neighborhoods particularly hard.
This is not a new phenomenon. Poor infrastructure provides fertile initial conditions for such reductions in service. In states like Texas, poor neighborhoods are often located near industrial sites. These sites can release additional pollutants during some emergencies, like floods, raising additional health concerns.
Many urban poor lack access to automobiles and rely on public transit, as Glaeser and Kahn have documented, which can trap them in affected areas. For example, several years ago during Wisconsin debates on voter ID, I calculated that 20 percent of Milwaukee city residents had no access to cars. Two-thirds of Milwaukee's population is minority (Black, Hispanic or Asian).
Such lack of access to automobiles can limit a family's ability to seek shelter from friends and neighbors during emergencies. To quote Kromm and Sturgis,
“While about 80 percent of New Orleans residents heeded the mandatory evacuation order issued before Katrina, tens of thousands stayed behind—and the number-one reason they gave was that they lacked cars. Indeed, at the time of the storm, about one-third of New Orleanians—approximately 120,000 people—did not own automobiles.”
The Disinformation Machine at Work
 |
| Exhibit 9 |
Sources: Fox, OAN, Twitter
We could post dozens of quotes from politicians and media that put forward the canard that wind and/or renewable energy is primarily if not uniquely responsible for the Texas energy debacle.
A quote from
Tucker Carlson represents this view: “Global warming is no longer a pressing concern here. The windmills froze, so the power grid failed.” In the first sentence, Carlson has confused climate and weather a surprisingly common mistake in some quarters. Readers seeking guidance on the difference can consult many sources, e.g., the National Ocean Administration, or NASA. This post is more directly concerned with the second sentence. Carlson’s claim that reliance on wind power was a principle cause of failure of the Texas power grid, repeated by
Larry Kudlow,
Rick Perry among others is facile and incorrect.
"This shows how the Green New Deal would be a deadly deal for the United States of America. ... Our wind and our solar got shut down, and they were collectively more than 10 percent of our power grid, and that thrust Texas into a situation where it was lacking power on a statewide basis."
Well, there's room to debate reported specifics of the
Green New Deal even if you support a speedy transition to renewables. For the record, I'm a fan of the latter, not so much of the former (especially in its
first drafts). For example, I don't see a total shutdown of fossil fuels by 2030 as a realistic proposition, and I think the GND's claims to solve tough problems of growth and distribution are grossly overstated, at best. But politicians and pundits should be called out when they use the GND as a red herring to push back against a transition to renewables that is, sooner or later, inevitable.
Oh, and while we're thinking of environmental policies, did I mention --
a carbon tax? (Be still, my heart).
Texas' Energy System
 |
| Exhibit 10 |
Texas does indeed obtain a significant portion of its electricity from wind.
Much of the growth in windpower came under the governorship of -- wait for it --
Rick Perry. (The same Rick Perry who
couldn't remember the name of the Department of Energy, who later ran it, surprised to find the breadth of DoE's responsibilities, including
nuclear safety.
 |
| Exhibit 11 |
Source:
ERCOT
Texas set up a statewide grid largely unconnected to the rest of the country to avoid regulatory and other costs. This did lower short-run costs, but also limited Texans ability to draw on resources from other states in an emergency. Texas also chose to save money in the short run by failing to weatherize windmills. In fact, they failed to weatherize many parts of their energy infrastructure, including but not limited to critical components of gas production and distribution.
The Texas electricity regulator estimated peak winter demand at 67,000 megawatts. But as people resorted to space heaters and other electric devices to try to warm up, demand for electricity hit 69,000 megawatts at a time when 30,000 megawatts of power went off-line. This 30,000 MW off-line was twice the level that the Electric Reliability Council of Texas (ERCOT) used as their extreme generator outage for scenario planning.
 |
| Exhibit 12 |
Texas does indeed have electricity rates somewhat below the national average -- but actually higher than neighboring Louisiana and Oklahoma, who manage to run their systems while connected to the national grid and subject to the resulting regulations.
 |
| Exhibit 13 |
It’s true that icing did force many turbines to shut down in Texas and elsewhere throughout the South and Midwest during this freeze. But Texas was hit much harder than other states. According to a Bloomberg report, in Texas wind shutdowns accounted for about 13 percent of the 30 to 35 gigawatts of total outages.
 |
| Exhibit 14 |
Wells and pipelines froze, pumps failed. Texas’s thermal plants – plants that generate electricity using heat from gas, coal, petroleum or nuclear energy – went off-line. The decline in thermal sources was the largest source of supply shortfalls.
 |
| Exhibit 15 |
This photo is not from Texas, and not from 2021.
It is taken from my urban environmental teaching library, and represents damage to the power lines in other elements of the grid itself.
 |
| Exhibit 16 |
Keeping the grid in repair during and after storms requires extreme and sometimes heroic efforts from utility workers. In fact, it’s often no easy job in “normal” times.
Many deserve credit for their response to this and similar emergencies, year in and year out, including utility workers but also emergency responders, the people who run shelters, those who keep retail establishments open, those who represent "
the kindness of strangers..." in fact far too many others to enumerate here.
And of course, all credit to those bellwether supporters of society during emergency conditions in much of the country: the operators and staff of
Waffle House.
 |
| Exhibit 17 |
Before we examine the pre-and post-storm performance note the following features. Solar generation (not including most home installations) are a small part of Texas' electricity generation, a few gigawatts (GW) or about 2 percent of generation according to the 2019 EIA data. And of course, as the cycle clearly visible in this chart shows, solar electricity is only generated when the sun is out.
Nuclear power provides about 5 GW of Texas electricity and coal 10 GW; these two sources are in normal times the rock steady-state providers.
Wind averages about the same generation as nuclear, but is more volatile.
Natural gas is by far the most important single fuel, providing 30 to 40 GW of power, more or less. Gas is not only the largest source, but is also the swing provider in normal times.
As the extreme cold hit after Valentine’s Day, gas and wind (the major swing providers) initially peaked: gas provided energy in the mid-40’s GWs while wind approached 10 GW.
But as the storm progressed, and elements of all power sources faced operational problems, gas fell down to the high 20s and wind felt down to about a GW.
Notice that solar actually picked up a little bit of the slack when the sun was shining.
 |
| Exhibit 18 |
These data on wind and solar are annual averages. I obtained data on 2019 state electricity generation by source from the energy administration an average winter temperature from weather data. Those data are used to construct Exhibit 18.
No surprise, Hawaii is the warmest state on average during the winter. Florida is also quite warm on average, followed by Louisiana, Georgia, Texas, California and some other southern and southwestern states.
Alaska is the coldest state. I lived in Wisconsin for 26 years which I found to be plenty cold. But I don’t really mind cold weather is much as heat and humidity. If it’s cold, I can wear my down coat, and most of the places I’ve lived had had central heating. Nevertheless, the chart shows why I always felt just a bit sorry for my friends in Minnesota. And Iowa. North Dakota’s pretty cold as well.
The vertical axis measures the percentage of state electricity generated from wind and solar combined, the renewables that so concerned Tucker Carlson above. Actually in virtually all the states the majority of that renewable energy comes from wind, which to date is generating more for the grid than solar. You can download a small spreadsheet with some of the details of this data
here.
The central finding for our purposes today is obvious. Texas averages about 20 percent of its electricity generation from renewables, primarily wind. Plenty of states with much colder climates including Kansas Iowa, the Dakotas, Minnesota, Maine, and Vermont have similar or higher levels of electricity from renewables. Because they insulate and maintain their equipment better than Texas, and because they are plugged into a larger grid for backup, these states have fewer problems under much more challenging weather conditions.
Of course, that doesn’t mean there are never outages or problems when storms hit Kansas or Iowa, far from it. But it’s clear from many sources that Texas had a clear path to prepare for such events and chose not to take it.
One roadmap for such preparations was prepared after a 2011 extreme cold event, and is available here.
(By the way, there are some differences between data in this chart, and seasonal data cited above. Wind and solar are more heavily utilized during summer, when air conditioning and other demand peaks, and their production usually falls during the winter. For example, in Texas wind can produce as much as 60 percent of Texas’s total electricity production during peak seasons; but wind turbines generally drop to 20 to 40 percent of their maximum output during winter under normal lower-demand winter conditions.)
 |
| Exhibit 19 |
Source:
Lake Erie Energy Development Corporation
Exhibit 19: The Pori 1 Turbine installed in Finland demonstrates that turbines can manage under extreme conditions, if properly designed and maintained.
“Pipelines can be buried deeper to insulate against the ground’s cold surface. When gas supplies are disrupted, dual fuel power plants can switch from gas to petroleum stored on site. Wind turbines can be equipped with heaters to keep blades free of ice. Sensors, valves and coolant intakes can be protected against freezing. Long-distance powerlines can connect to other regions power system and draw from their supplies during times of need.”
But up until now Texas has eschewed these measures because of their cost.
The Transition from Fossil Fuels to Renewables is Underway
 |
| Exhibit 20 |
For an interesting and entertaining account of the very long run, see William Nordhaus' account of energy sources over a millennium. We appear to be on the cusp of another major transition: from fossil fuels to renewables.
Such transitions are by no means limited to energy. Here's another well-known transition, that took place about a century or so ago:
 |
| Source: 21 |
 |
| Exhibit 22 |
Source: Grubler et al.
Exhibit 22 shows how rapidly a change in technology can take place, once technical and economic thresholds are reached. In just a few decades after the development of mass-market automobiles, the horse went from a major mode of transport, to a hobby.
The pace of technical change is much more rapid than a century ago. The ongoing transition to renewables will take some time, though it's hard to put an exact timeline on it. It is well-known that current storage technology is low-capacity relative to total loads, and is very expensive. Improvements in storage technology are underway and will be required for intermittent energy sources including wind and solar to successfully transition to a large part of total energy production.
In the short run, I would imagine over several decades, fossil fuels will remain a significant energy source. During this transition, cleaner fossil fuels like gas (with technical and regulatory changes that reduce their climactic impact, e.g. reducing methane escape during production and transport) will become increasingly important for a few decades. Nuclear power is another baseload power source which faces technical and political challenges, each difficult but neither insurmountable in principle. The forecast that nuclear-generated electricity would be "
too cheap to meter" reminds us to have some humility about our ability to foresee all the elements and timing of future electrical generation.
Learning more about infrastructure
Here’s some sources on energy-related infrastructure. Some have been consulted for the posting above, others are sources as we prepare the section on infrastructure for the forthcoming Future of Real Estate project.
Borck, Rainald, and Jan K Brueckner. "Optimal Energy Taxation in Cities." Journal of the association of environmental and resource economists 5, no. 2 (2018): 481-516.
Federal Energy Regulatory Commission and the North American Electric Reliability Corporation. "Report on Outages and Curtailments During the Southwest Cold Weather Event of February 1-5, 2011." 2011.
Ferguson, Charles D. Nuclear Energy: What Everyone Needs to Know. OUP USA, 2011.
Gilbert, Alan. "The Return of the Slum: Does Language Matter?". International Journal of Urban and Regional Research 31, no. 4 (2007): 697-713.
Glaeser, Edward L, Matthew E Kahn, and Jordan Rappaport. "Why Do the Poor Live in Cities? The Role of Public Transportation." Journal of Urban Economics 63, no. 1 (2008): 1-24.
Grübler, Arnulf, Nebojša Nakićenović, and David G Victor. "Dynamics of Energy Technologies and Global Change." Energy policy 27, no. 5 (1999): 247-80.
Irvine, Maxwell. Nuclear Power: A Very Short Introduction. OUP Oxford, 2011.
Kahn, Matthew E, Nancy Lozano‐Gracia, and Maria Edisa Soppelsa. "Pollution's Role in Reducing Urban Quality of Life in the Developing World." Journal of Economic Surveys 35, no. 1 (2021): 330-47.
Kahn, Matthew E, and Erin T Mansur. "Do Local Energy Prices and Regulation Affect the Geographic Concentration of Employment?". Journal of Public Economics 101 (2013): 105-14.
Kromm, Chris, and Sue Sturgis. "Hurricane Katrina and the Guiding Principles on Internal Displacement." Institute for Southern Studies, 2008.
Levi, Michael. The Power Surge: Energy, Opportunity, and the Battle for America's Future. Oxford University Press, 2013.
Nordhaus, William D. The Climate Casino: Risk, Uncertainty, and Economics for a Warming World. Yale University Press, 2013.
———. "Do Real-Output and Real-Wage Measures Capture Reality? The History of Lighting Suggests Not." In The Economics of New Goods, edited by Timothy Bresnahan and Robert J Gordon, 27-70: University of Chicago Press, 1996.
Raimi, Daniel. The Fracking Debate: The Risks, Benefits, and Uncertainties of the Shale Revolution. Columbia University Press, 2017.
Thompson, William L. Living on the Grid: The Fundamentals of the North American Electric Grids in Simple Language. iUniverse, 2016.
Usher, Bruce. Renewable Energy: A Primer for the Twenty-First Century. Columbia University Press, 2019.
Willrich, Mason. Modernizing America's Electricity Infrastructure. MIT Press, 2017.
Yergin, Daniel. The New Map: Energy, Climate, and the Clash of Nations. Penguin Press, 2020.


No comments:
Post a Comment